Plotting with Matplotlib
Matplotlib's is a library for plotting in Python in a similar way it is handeled in Matlab. It is usually used with pyplot - an interface for using matplotlib. Other notable plotting libraries are Seaborn, Plotly and an API inside pandas.
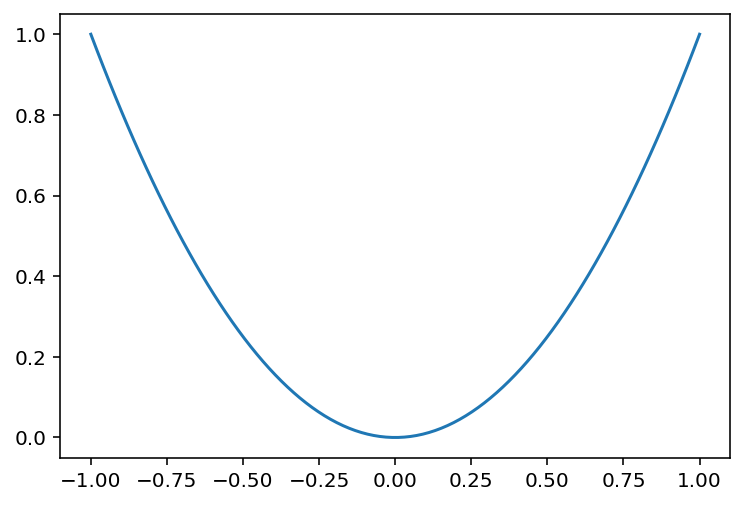
The following example shows the minimum effort way of plotting with Matplotlib.
After importing pyplot and numpy, a parabola y is calculated from a set of values x.
The .plot() function takes two arguments and plots them as abcissa and ordinate, respectively:
from matplotlib import pyplot as plt
import numpy as np

# input values
x = np.linspace(-1,1,100)
# calculate parabola
y = np.pow(x,2)

# plot
plt.plot(x,y)
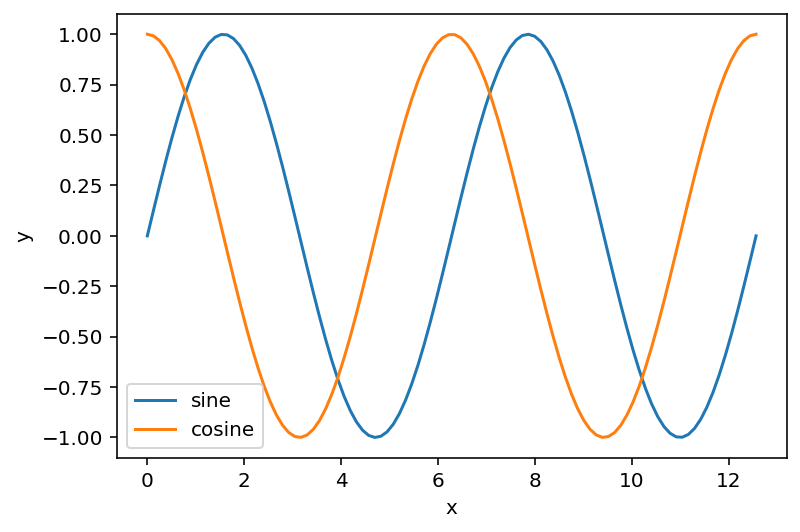
Axis Labels & Legends
from matplotlib import pyplot as plt
import numpy as np

# input values
x = np.linspace(0,4*np.pi,100)
y1 = np.sin(x)
y2 = np.cos(x)

# plot
plt.plot(x,y1, label="sine")
plt.plot(x,y2, label="cosine")

plt.legend(loc="lower left")

plt.xlabel("x")
plt.ylabel("y")
Exporting Plots
Exporting high quality plots is crucial for scientific reports and publications.
Print to Graphic File
PNG files are the preferred compressed format for graphics. Make sure to increase the resolution (dpi) to get a high quality:
from matplotlib import pyplot as plt
import numpy as np

# input values
x = np.linspace(-1,1,100)
# calculate parabola
y = np.pow(x,2)

# plot
plt.plot(x,y)
plt.savefig('parabola.png', dpi=600)
For better quality, use a vector format, such as PDF:
Export as PGF/Tikz
While PDF files have perfect resolution, they have fixed properties, such as font type or line width. The best option for fully integrated plots is the PGF/Tikz system inside LaTex: https://tikz.dev/
Tikz renders graphics inside LaTex, based on text files with data points. A PGF file can be exported directly from MatPlotLib:
import matplotlib
import matplotlib.pyplot as plt

matplotlib.rcParams.update({
    "pgf.texsystem": "pdflatex",
    'font.family': 'serif'
})

plt.plot([1,2,3])

plt.savefig('myfig.pgf')
The generated text file can be easily integrated in a LaTex document with the input directive:
If no LaTex system is installed, the pfg file is created but an error is thrown. Backends are
'xelatex'
'lualatex'
'pdflatex'
TexLive is recommended (big package):
In Windows:
In Linux (Debian):
$ sudo apt install texlive-full